(2020-05-15) Dixon The Crypto Price-Innovation Cycle
Chris Dixon: The Crypto Price-Innovation Cycle. People who’ve been in crypto for a long time view the space as evolving in cycles, alternating between periods of high activity and “crypto winters.” There have been three cycles so far. The first peaked in 2011, the second in 2013, and the third in 2017
we analyzed 10 years of data, including Reddit comments in crypto subreddits, Github commits in crypto repos, and Pitchbook funding data
- I'm noting Bitcoin price peaks/valleys below (and using month-start values, so not absolute peaks/valleys) (and using rounded values)
The First Cycle: 2009-2012 peak Jul01'2011=$15, valley Dec01'2011=$3
Notice how developer, social media, and startup activity is sustained even after prices decline
The Second Cycle: 2012-2016 peak Dec01'2013=$950, valley Sept01'2015=$230
The Third Cycle: 2016-2019 peak Jan01'2018=$13k, valley Feb01'2019=$3.5k, rebound peak Jul01'2019=$11k, rebound-valley Apr01'2020=$6.7k
The 2017 cycle spawned dozens of exciting projects in a wide range of areas including payments, finance, games, infrastructure, and web apps. Many of these projects are launching in the near future, possibly driving a fourth crypto cycle.
All this commentary is nonsense, I'm saving it just for the data overview.
Fourth cycle? Peak Apr01'2021=$59k, mini-valley Jul01'2021=$34k, Sept01'2021=$49k, Sept06'2021=$53k, Sept21'2021=$40k, Nov09'2021=$65k, sliding since.... (as of Jan05'2022=$44k)
Here's the whole lifespan, with a log scale
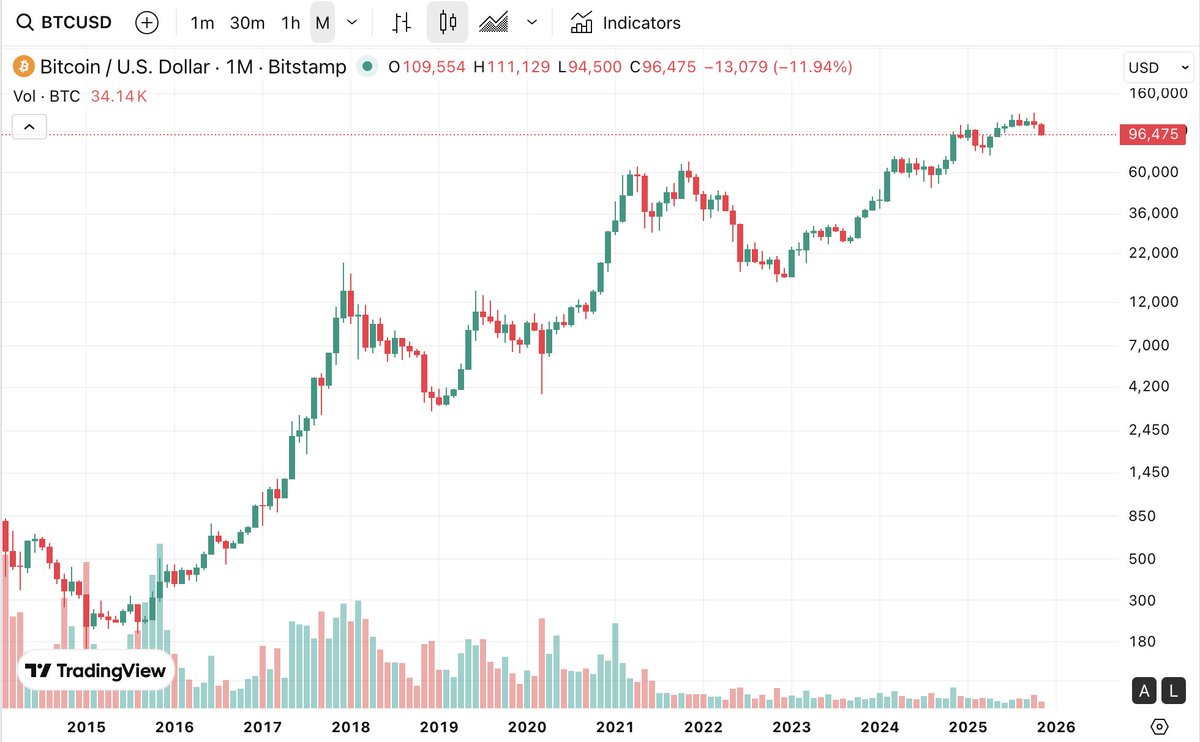
Here's a nice candlestick chart, which I used for the snaps aboev.. If you set it for monthly, you get the whole history (ooh you can drag to narrow the time window and the y-axis adjusts!); if you set it for weekly, you get almost 2 years. That's how I got the screenshots above.
Nov14'2025 fresh monthly chart since 2014:
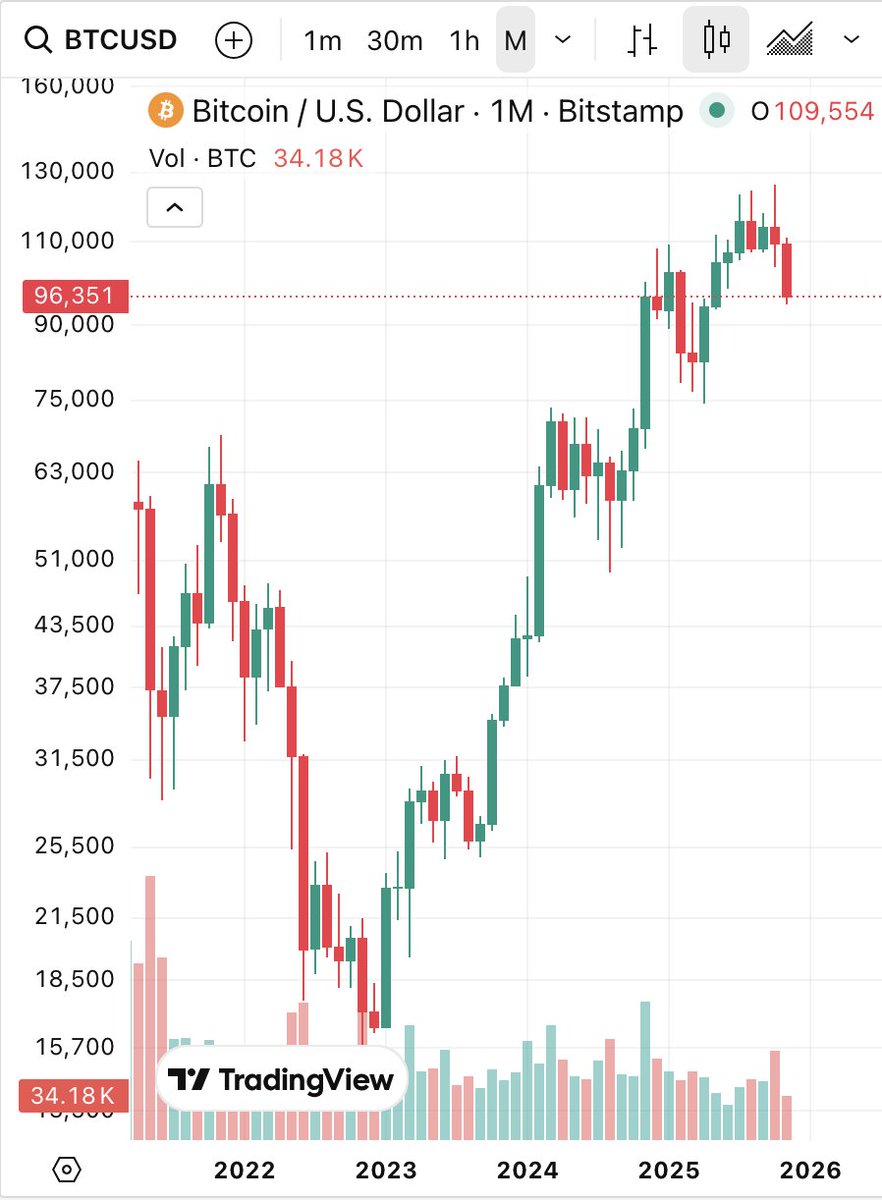
Monthly since 2021:
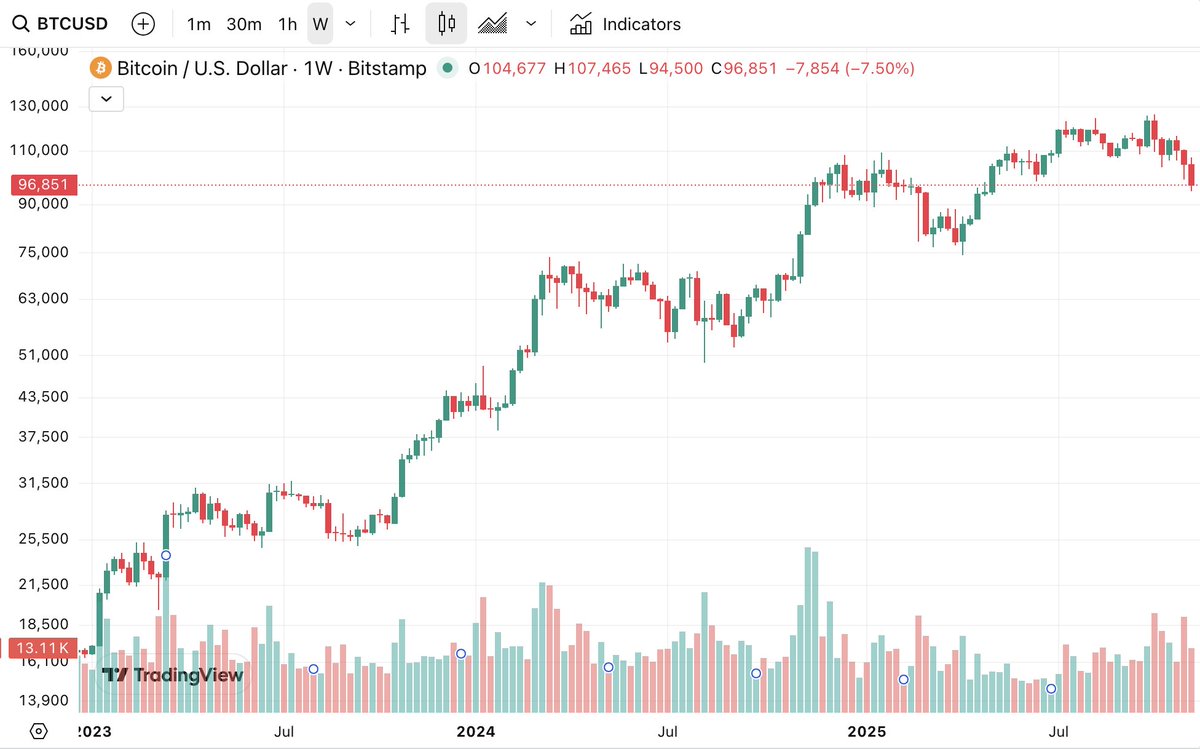
Weekly since 2023:
May'2026
- peak Oct'2025 $124k
- local bottom Feb'2026 $63k
- current $75k
Edited: | Tweet this! | Search Twitter for discussion

 Made with flux.garden