Virtual ThinkingSpace
Idea of a Virtual Reality-based ThinkingSpace. Goal: Augmenting Human Intellect.
As your collection of SenseMaking nodes gets bigger and bushier, trying to manage it on a flat screen is a problem.
So put them in a virtual space surrounding you.
- Feb'2024: pondering in the context of the Apple Vision Pro
See: WikiGraph Browser/Everything is a Graph, Webs Of Thinkers And Thoughts, Highlighting And Annotating.
Multi-user aspects (to be dug through later): WikiWebDialogue; ThinkerWeb
Technology inspirations: 2014-11-05-D3jsForThreadedChatHolocene, Minority Report/2011-12-19-RaoTabletTouchTinkerUi, 2014-04-23-BrowserWindowGroupsOrSpaces
Hybrid-display idea (because I hate wearing goggles so far)
- projectors on multiple walls and ceiling (hmm Dynamicland)
- Kinect/gesture UI to move objects or move POV
- but detailed reading/interaction with a specific object happens on your laptop - there's a simple gesture to mirror an item there, where you have hi-res monitor and keyboard
The room is filled with a three-dimensional constellation of hypercards, hanging weightlessly in the air. It looks like a highspeed photograph of a blizzard in progress. In some places, the hypercards are placed in precise geometric patterns, like atoms in a crystal. In other places, whole stacks of them are clumped together. Drifts of them have accumulated in the corners, as though Lagos tossed them away when he was finished. SnowCrash
Some usage patterns
A "thinking session" (digital gardening) (which could last 15min or months) involves
- starting a new "document" as session/container
- reviewing existing nodes (via connections, search, etc)
- my defunct Wiki Graph Browser was good for incrementally loading local graph
- note Miro lets drag browser windows into whiteboard to add node with title/link
- "keeping" some while "pushing away" others
- seeing existing connections among the kept nodes
- moving nodes around in visual whiteboard
- creating new connections
- creating new nodes
- rewriting existing nodes
Hmm, for a "session" like this, since it's more-limited in num-cards, do you need 3D? Or just a better 2D view? Auto/dynamic zooming/fish-eye focus? (see rough d3.js example)
- could the browser or OS provide this view for a set of windows? Yes, but they would lack the connectors.
Each "node" is an icon/object floating in space around you.
- a node (document) is really a collection of nodes (NodeWeb)
Zooming in to a node to read, highlight.
Visible connections between nodes ("Beautiful Mind" yarn)
- Paragraph-Addressable connections
- Force-Directed graph as default?
- you can easily add connections (kinda like The Brain, but a link involves adding a WikiWord at the bottom of each doc?)
"Group" set of nodes so they "stay close" to each other. (You can make any number of them, and strengthen/weaken their grouping at any moment based on your context.)

read-only spike
Jul'2018 looking at some libraries even if read-only
- https://github.com/vasturiano/3d-force-graph-vr Uses A-Frame for VR rendering and d3-force-3d for the layout physics engine.
- A-Frame https://aframe.io/ Make WebVR with HTML and Entity-Component: Works on Vive, Rift, Daydream, GearVR, desktop
- https://bl.ocks.org/vasturiano/972ca4f3e8e074dacf14d7071aad8ef9
Zach Kinstner work
- https://medium.com/@zachkinstner
- HoverUI https://github.com/aestheticinteractive/Hover-UI-Kit
- (last commit over a year ago)
- wiki https://github.com/aestheticinteractive/Hover-UI-Kit/wiki
- Dec'2016 https://medium.com/@zachkinstner/devup-force-directed-graph-in-vr-9e6bf3e1a351 Hover UI Kit for user interfaces; Prior work on 3D force-directed graphs; Leap Motion SDK for hand input (LeapMotion); Unity 3D engine and in VR support (unity3d)
- Feb'2017 https://www.youtube.com/watch?v=O-AwY0gYLlQ: I wrote the 3D force-directed graph functionality with custom C# code. The code maintains its own forces/physics calculations, but it can also utilize Unity physics to make it more interactive (i.e. the ability to hit and push the nodes)... My goal is to eventually turn this demo into a data-viz product -- and I've had a few clients paying for new features to the demo itself -- so for now I don't plan to open-source the project.
work on Asturiano approach
Jul02'2018 Going to try the larger-graph example
- although the text-as-nodes idea is cool, too.
- since this relates to my WikiGraphBrowser work, will deliver within WebPy server
- have old graph-file: only 170 nodes!
Jun03
- make
/visualThinkingSpace/directory inside/static/ - make
index.htmlpage containing justtest- works http://localhost:8080/static/visualThinkingSpace/ - replace
index.htmlwith contents from here; createblocks.jsonfrom here- looks like right container page, but no nodes, suspect need to change code path to
blocks.json - simple attempt failed, not clear on how the path is defined...
- hit
blocks.jsondirectly, realize (derp) there were some fake bits in there, so fix that file - try hitting
index.htmlagain, same empty container
- looks like right container page, but no nodes, suspect need to change code path to
- FireFox crashed my system, restarted, switched to Chrome. Now it works!
- make real graph file
- find old
jsonfrom building WikiGraphBrowser - obviously wrong format, but have raw text file, and script that transformed that into JSON. So will fork script.
- find old
- works! (except node-names 'undefined') https://twitter.com/BillSeitz/status/1014146058023309314
- would work on that 'undefined' name but realize that, given size of my graph, I should play with his nodes-as-text version first.
- go back to the previous "large" example
- realize that example's blocks.json is very different than the little example in the readme!
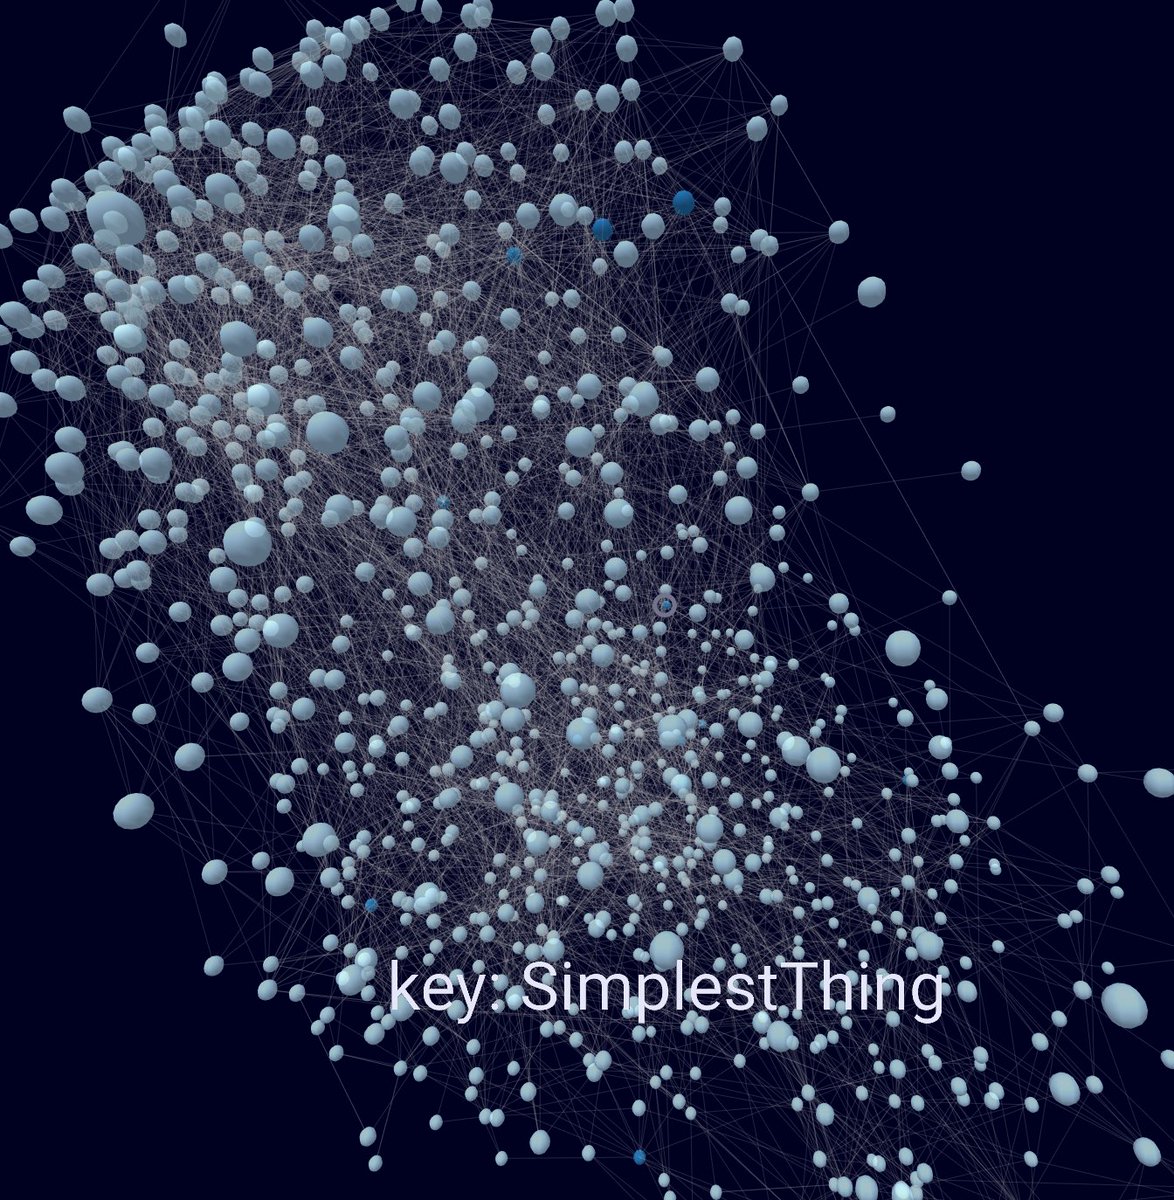
- yes! - (using prefix 'reg' for 'regular', 'key', 'blogbit')
- next
- make bigger file
- put online
- found big file, but it's a different format (it's the format I normally use when adding to my WikiGraph). Need to tweak JSON creator....
Jul05
- tweak JSON creator: num nodes: 39985, num links: 118907
- use JSON-link to check/clean https://jsonlint.com/
- lots of mess from non-ASCII names
- finally num nodes: 39834, num links: 118906
- works!
- copied live - works! http://www.wikigraph.net/static/virtualThinkingSpace/
- but because so huge, eats memory, pretty unusable on my laptop
- will try on family desktop
- and with GoogleCardboard
- hmm how move around with Cardboard? Links for later...
- but because so huge, eats memory, pretty unusable on my laptop
Jul06
- make node only if page actually exists: num nodes: 16965, num links: 89330
- nope still too big
- generate counts
- 39.8k gross rows
- drop
ISBNbecause it's not a "real" page - 4 pages have 400+ links: Python, NYC, Google, US. At 300-399: Wiki, WebLog, OpenSource, EBook, Dave Winer
- drop count=1 rows -> 12.1k
- drop count=2 rows -> 8.3k
- top 1k rows hit num=21 (and of num=21 puts me at 1027 rows.
- tried generating JSON just with 1k rows, but filtering isn't working right...
- fixed: num nodes: 1027, num links: 6125
- viewing with Chrome on my Pixel2-XL - you can fly forward, and as you look around the view shifts. But no node labels, which kinda defeats the purpose.
- any way to use Google Cardboard? Doesn't seem like it. Tried viewing phone with Chrome in the holder, make it more surreal but not really doing stereo, and still no controls or labels...
Twitter thread of screenshots: https://twitter.com/BillSeitz/status/1014146058023309314
Edited: | Tweet this! | Search Twitter for discussion

 Made with flux.garden